24observe
checking… Sign in Start free
OpenTelemetry-native · MCP built in · Self-hostable

One operational platform for your team — and your AI agents.

Agent telemetry, security detections, logs, incidents, and on-call in one system of record. Your engineers and your agents investigate, detect, and resolve from the same data — humans in the console, agents through the API and MCP.

7 check types 12 log sources 41 detections MITRE ATT&CK 3 OTLP signals
login.24observe.com
Overview · health + incidents
24observe dashboard — Overview · health + incidents24observe dashboard — Detections · 22 ATT&CK rules24observe dashboard — MITRE ATT&CK coverage24observe dashboard — Logs · search + facets24observe dashboard — Incidents24observe dashboard — Uptime monitors24observe dashboard — SLO + response time24observe dashboard — Correlation rules24observe dashboard — Threat-intel · IOCs24observe dashboard — Security cases24observe dashboard — Case · incidents + notes24observe dashboard — Pattern grouping24observe dashboard — Identity + asset context
What you replace

Four categories. One bill. One API.

Most teams stitch observability from four vendors — an uptime tool, a log platform, a SIEM, and "we'll need an SDK for that." We collapse all four into one self-hostable product an agent can actually drive.

01 / SYNTHETIC

Uptime · Pingdom / UptimeRobot / BetterStack alternative

HTTP, TCP, SSL/TLS, ICMP ping, port probe, keyword match, heartbeat / cron. Multi-region. SLO targets. Status pages with custom domains. Signed alert webhooks to Slack, Discord, Teams, Telegram, PagerDuty, Opsgenie. The full uptime-vendor surface, self-hostable. /features →

02 / LOGS

Logs · Splunk / Datadog Logs / Sentry alternative

Ship from Lambda, Heroku, Vercel, Docker, journald, OpenTelemetry, or just curl. Search by typing the words you remember. Auto-extracted facets on the side. Pattern grouping that collapses 10,000 similar lines. Error tracking — recurring stack traces as one row, no Sentry meter. /docs/logs →

03 / SECURITY

SIEM · detections, threat-intel, correlation

22 ATT&CK-tagged detections, multi-event correlation, threat-intel matching on every source IP, GeoIP + identity + asset enrichment, and security cases to run the investigation. A detection opens an incident in the same pipeline as a failed health check. More on security →

04 / AGENT API

Pure-REST API designed for AI agents

Pre-converted tool definitions for OpenAI, Anthropic, and LangChain. Signed event webhooks replace polling. Rate-limit headers your agent reads to back off. Idempotency-Key on every mutation. 21 narrow PAT scopes with daily caps. /agents →

Synthetic checks · apps/worker/src/checks.ts

Seven check types.
Every real thing your stack breaks at.

Each one is a real check in the repo — not a roadmap item.

GET

HTTP / HTTPS

Verifies status codes, measures response time, flags degradation before full outage.

200 · 418 · 503
TCP

TCP & port

Reachable-or-not checks for databases, message queues, anything that speaks TCP.

:5432 :6379 :27017
SSL

SSL / TLS certificates

Warns you 7 days before expiry. Validates cert chain, not just 200 OK.

expires in 87d
PNG

ICMP ping

Classic reachability from inside your network or ours.

24ms · 18ms · 22ms
PRT

Port probe

Like TCP, but for the case where the URL format does not include the port.

:22 :3306 :11211
KWD

Keyword match

Does the page still say "Order placed" — or is that 200 just a generic landing page?

match=true
HB

Heartbeat / cron

Inverted check — your job pings us. If silence past your interval, we open an incident. Auto-resolves on next ping.

POST /heartbeats/<token>
Logs

Your logs do more than scroll past.

Send them from anywhere. Make sense of them without learning a new query language. Catch the spikes you'd miss at 2am. Group recurring errors so one bug is one row, not a thousand. The things Datadog, Splunk, and Sentry each charge separately for — bundled into the same bill as your uptime checks.

01 / SEND

Ship from anywhere. No SDK.

Lambda functions land through CloudWatch. Heroku apps in one heroku drains:add. Vercel projects in one paste. Docker containers via the syslog driver. systemd units via journald. OpenTelemetry SDKs in any language. Vector or Fluent Bit pipelines. Or just curl structured JSON straight to a URL. All 12 sources →

02 / SEARCH

Type the words you remember.

No SPL to learn, no proprietary DSL. Plain substring works. So does service:checkout AND level:error when you want filters. Auto-extracted facets show up on the side — click a value, drill in. Live-tail new events as they land. Click a pattern to collapse 10,000 similar lines into the one shape that matters.

03 / CATCH

Page on-call only when it actually matters.

Threshold alerts when you know the magic number ("more than 10 errors in 5 minutes"). Spike-vs-baseline alerts when "normal" varies by service or time-of-day — no ML to configure, just "3× normal rate". Routes to email, Slack, Discord, Teams, Telegram, or any HMAC-signed webhook. One incident per fire, never a hundred.

04 / TRACK

When something logs an error, see it once.

Recurring stack traces collapse to one row with a count, first-seen, last-seen, and a sample. JavaScript, Python, Java, Go, generic ERROR:. The thing Sentry charges separately for, here for the same bill. Mark resolved when you've fixed it. Save any log search as a time-series and alert on it like any monitor.

Free 1 GB/mo. Startup 10 GB. Pro 100 GB. Self-host: unlimited. Every plan gets every feature on this page — no "intelligence tier".

Security · SIEM

A SIEM that fires into the same incident pipeline.

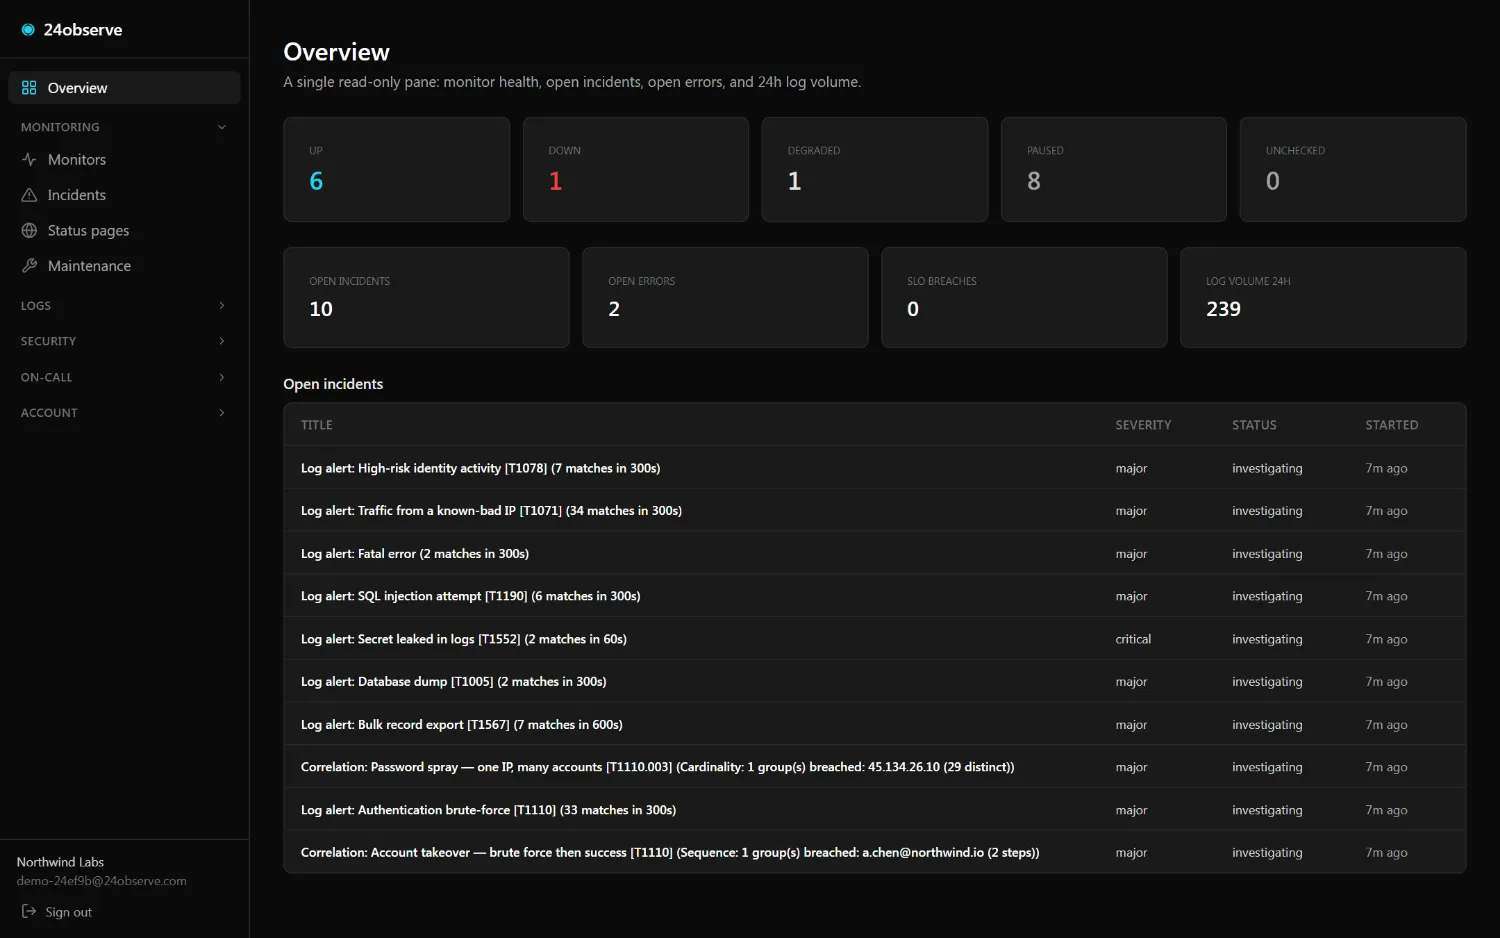
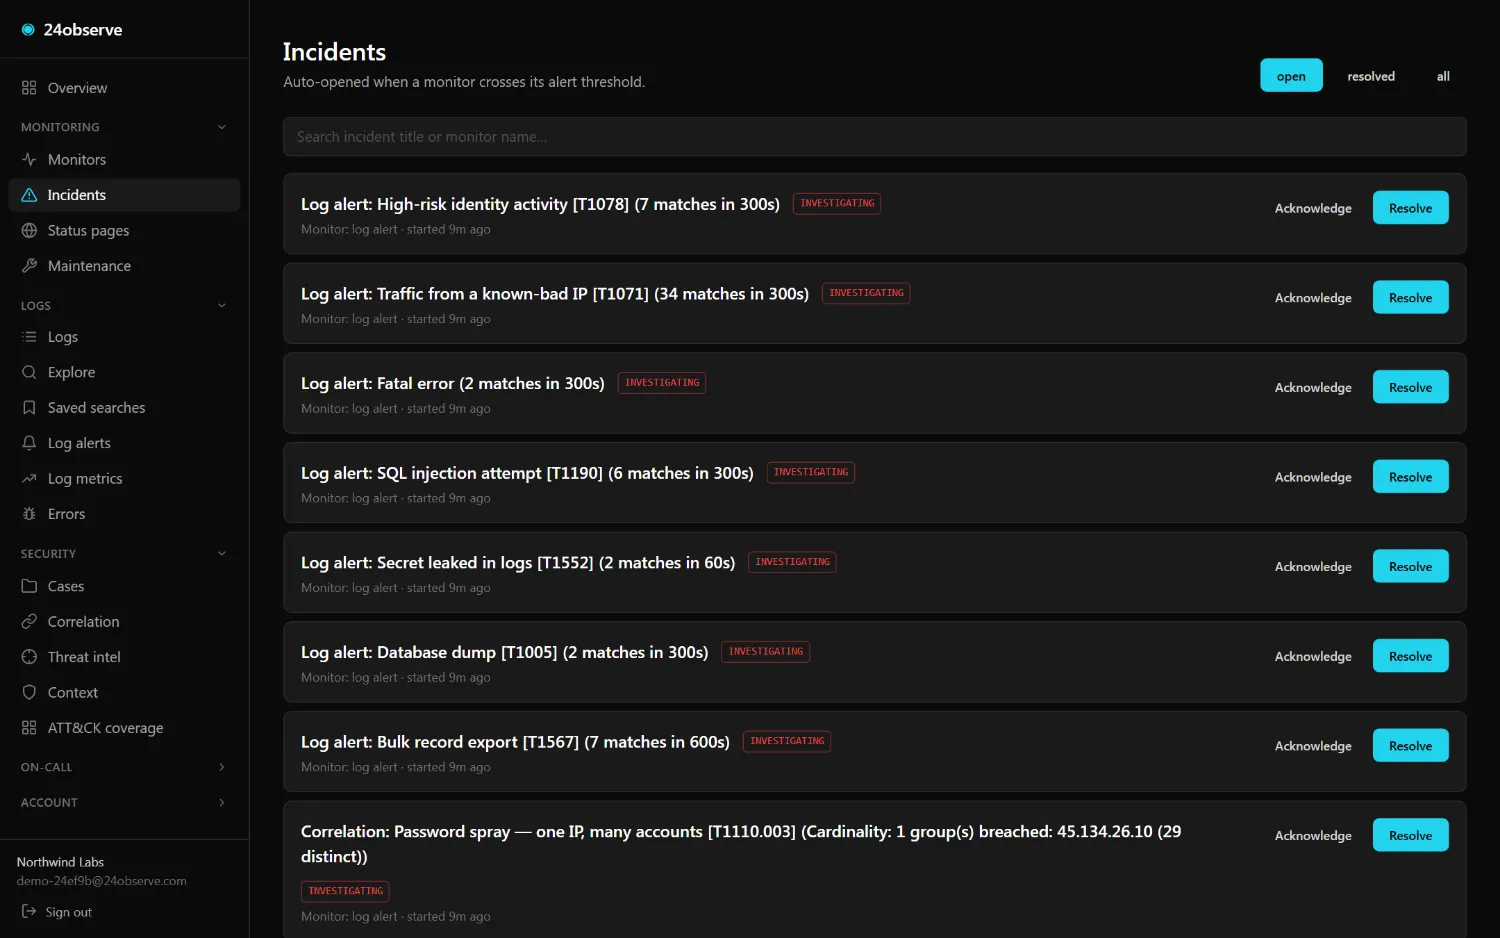
Most "observability + security" stories are two products and two bills. Here a detection is just another rule that opens an incident — same alerting, same cases, same API. Threat-intel and enrichment run inline at ingest, so the signal is already on the event by the time a rule looks at it.
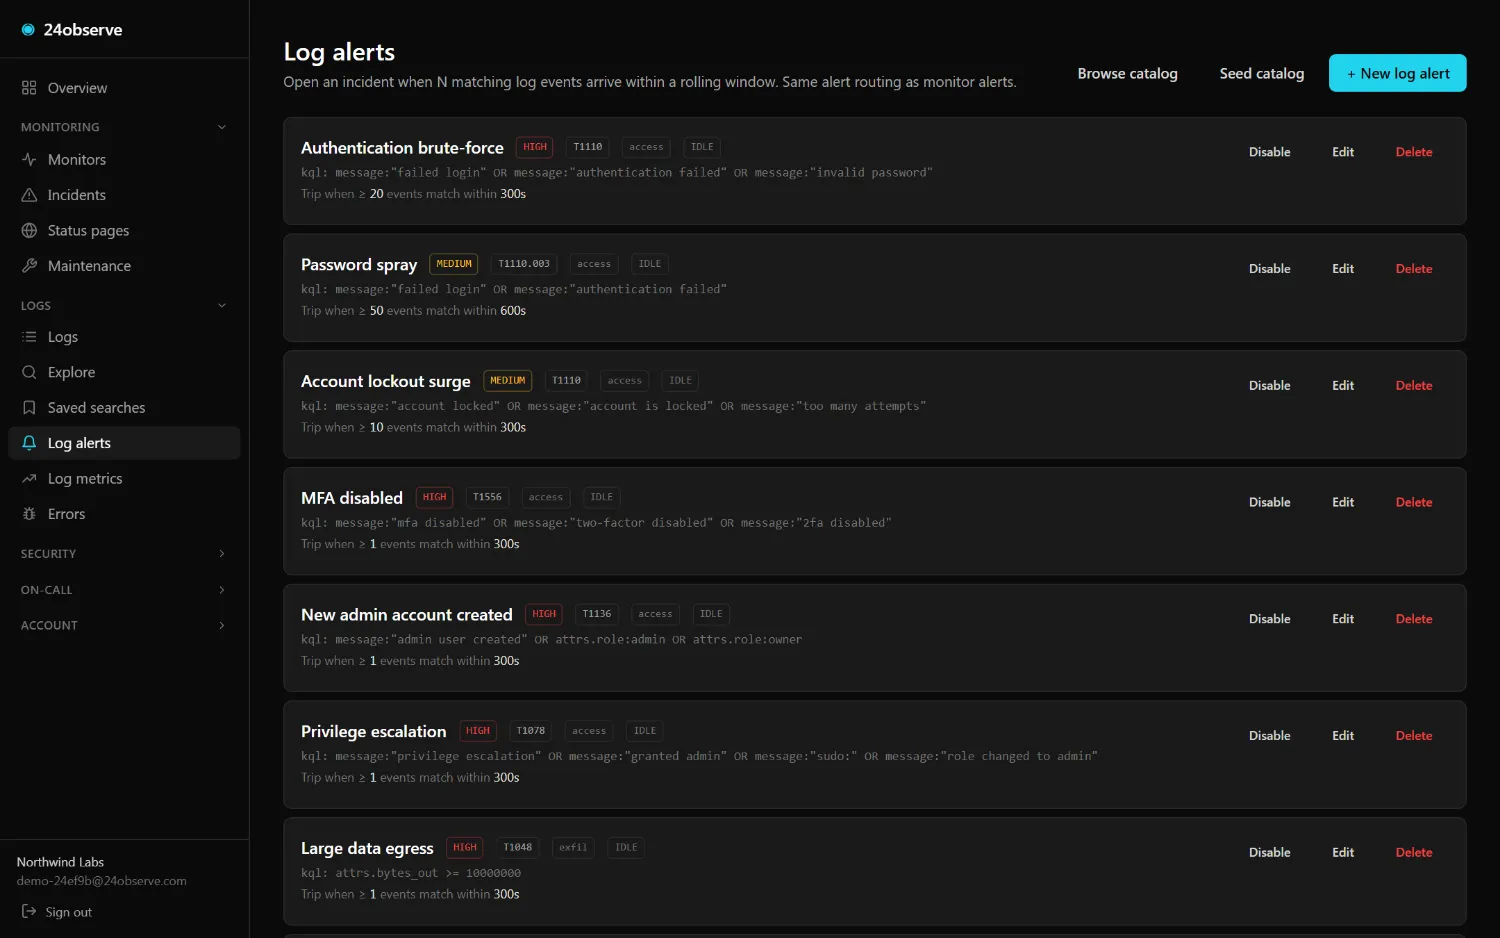
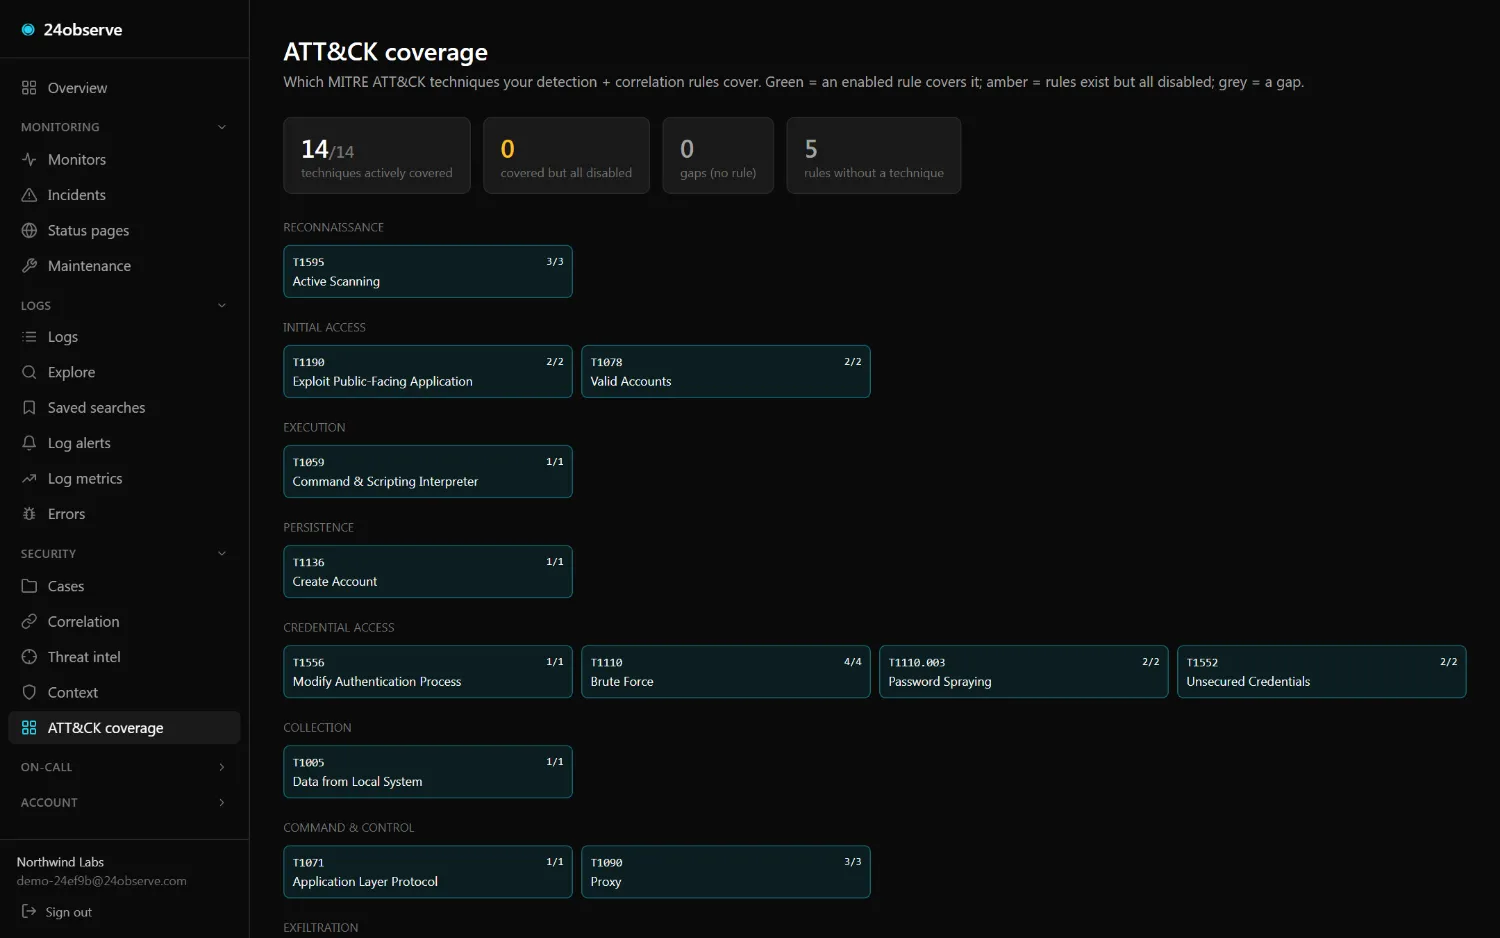
01 / DETECT

41 detections, ATT&CK-tagged

Prebuilt rules across access, exfil, secrets, web-attacks, reliability, threat-intel, AI-agent security, and MCP traffic — each carrying its MITRE ATT&CK technique where one applies. Write your own in one line of KQL-lite. They open incidents in the same pipeline as your uptime checks.

02 / CORRELATE

Multi-event correlation

The signals a single log line can't express. Sequence — failed logins then a success. Cardinality — one IP touching many accounts. Each is one ClickHouse query, run every minute.
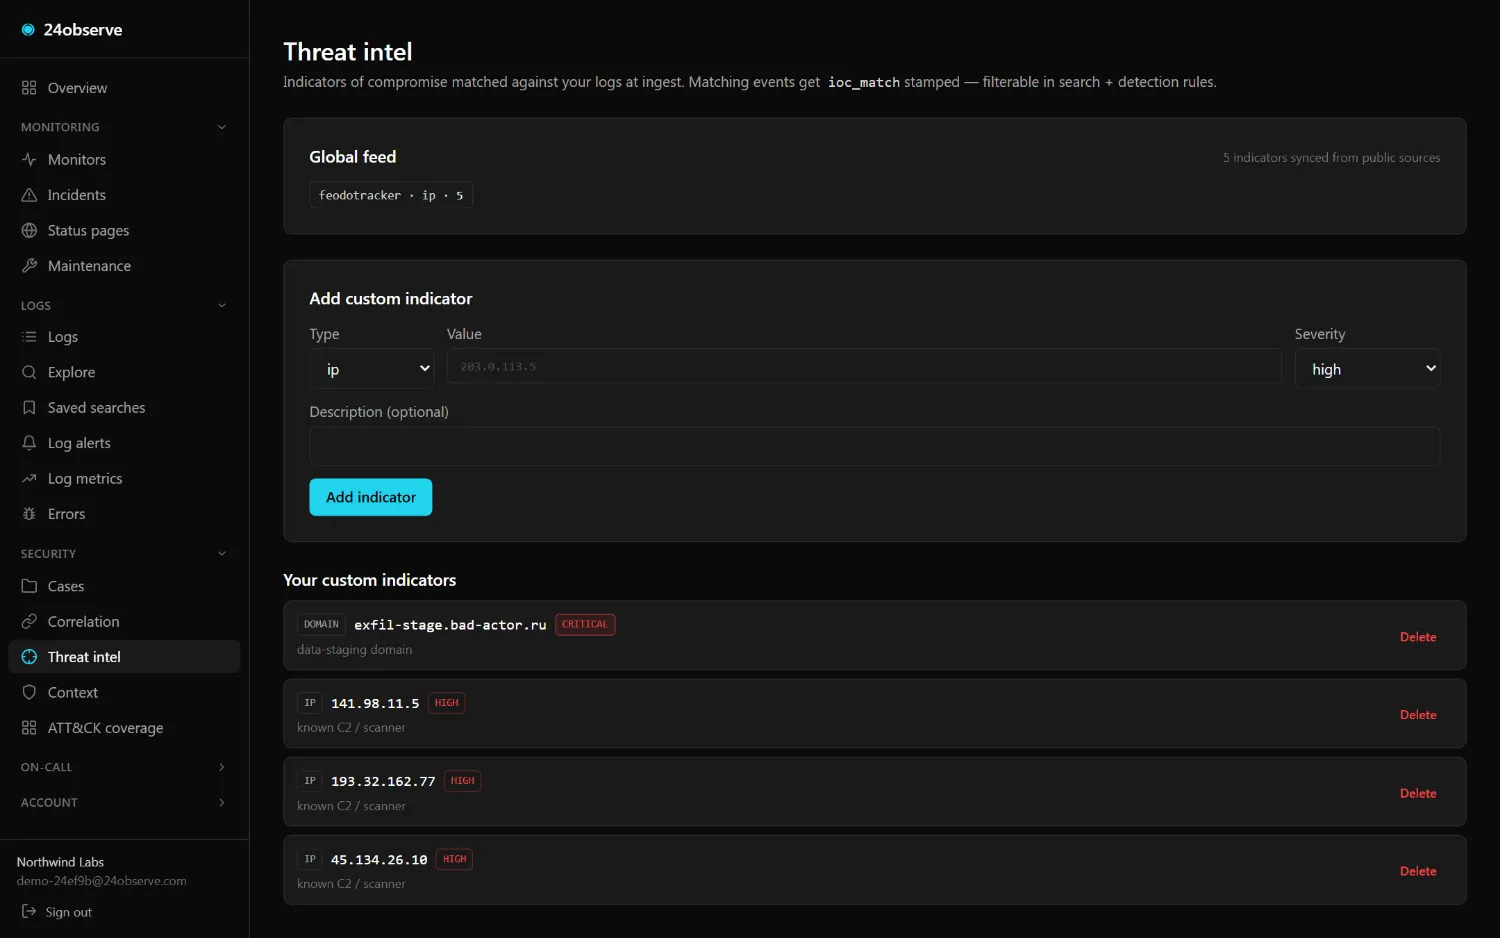
03 / THREAT INTEL

Every IP checked at ingest

Known-bad indicators, Tor exits, DNSBL listings, VPN and datacenter ranges — matched the moment an event lands. Bring your own IOCs (IP, domain, hash) or ride the built-in feeds.
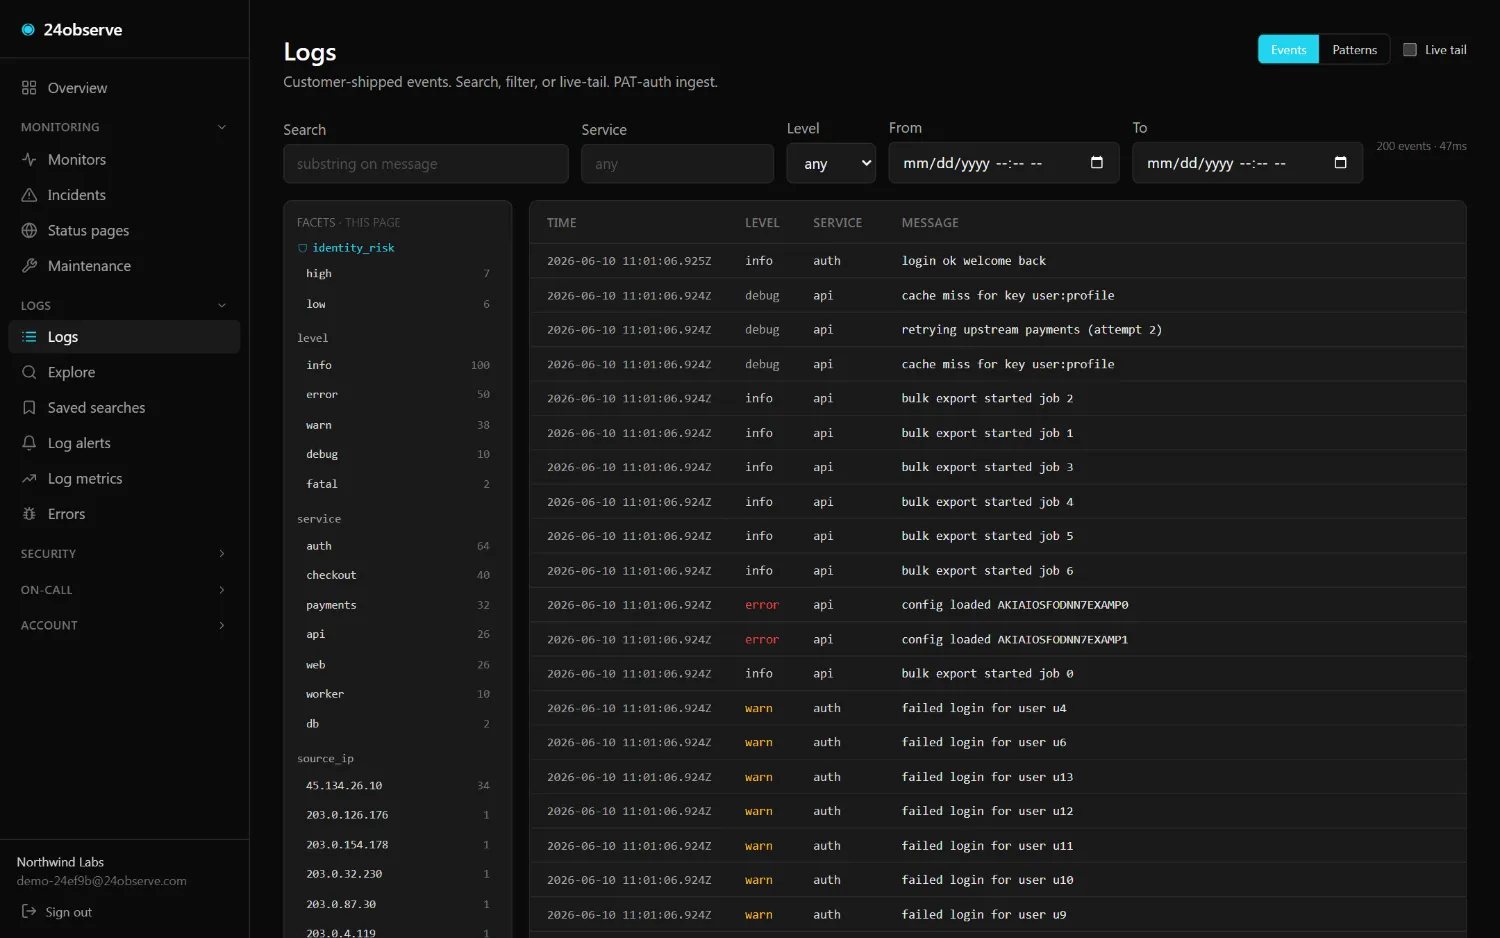
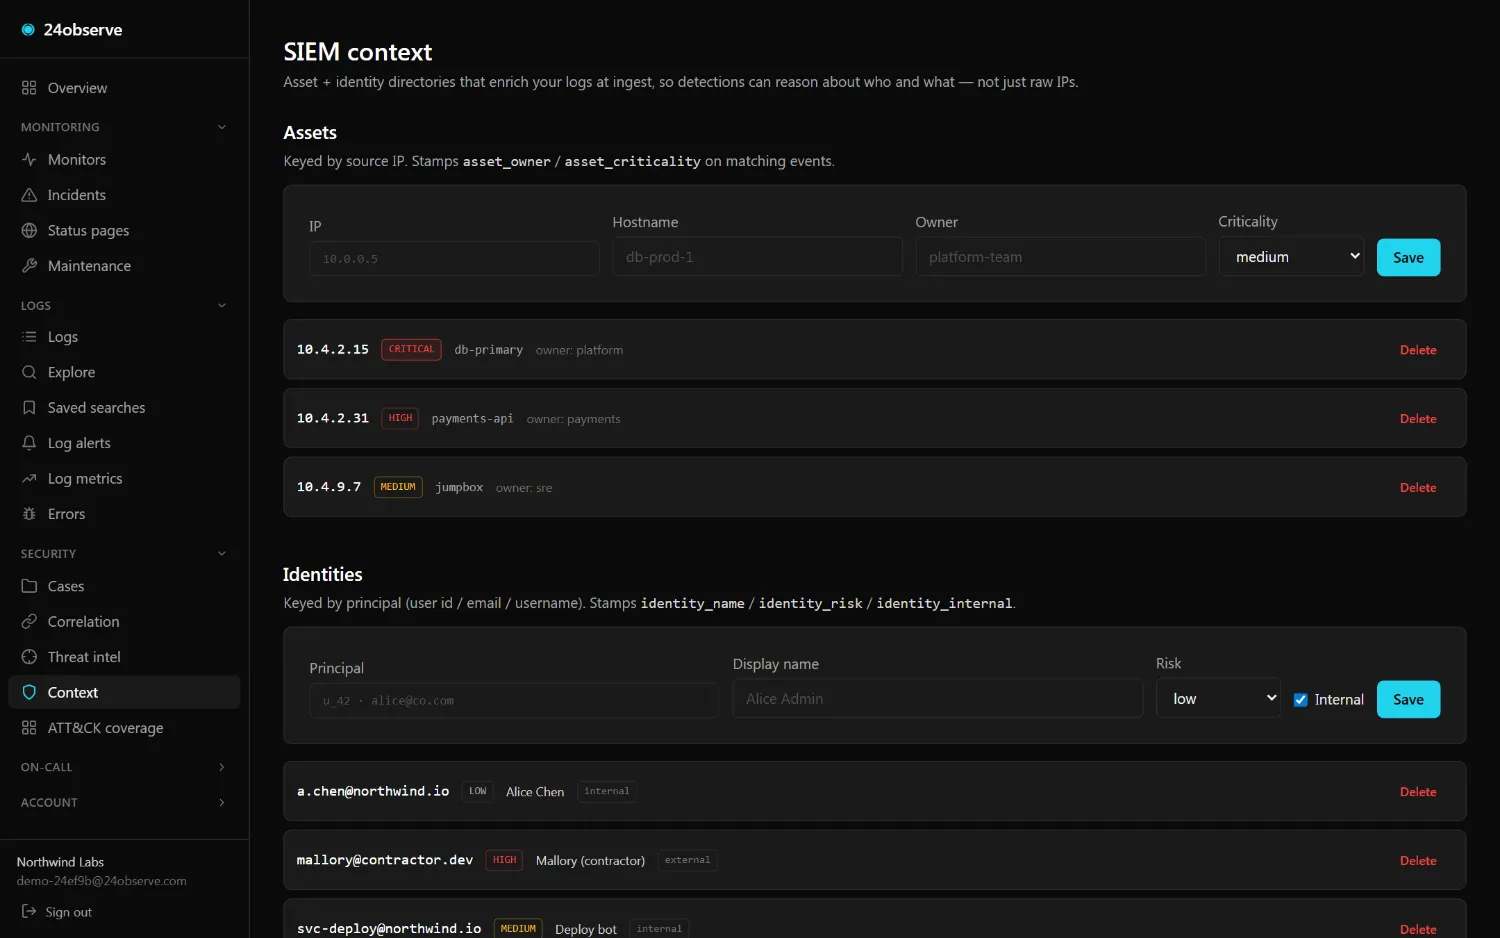
04 / ENRICH

Context on every event

GeoIP, ASN, identity risk, and asset criticality stamped inline at ingest — so asset_criticality:critical AND geo_country:RU is just a search, not a join.
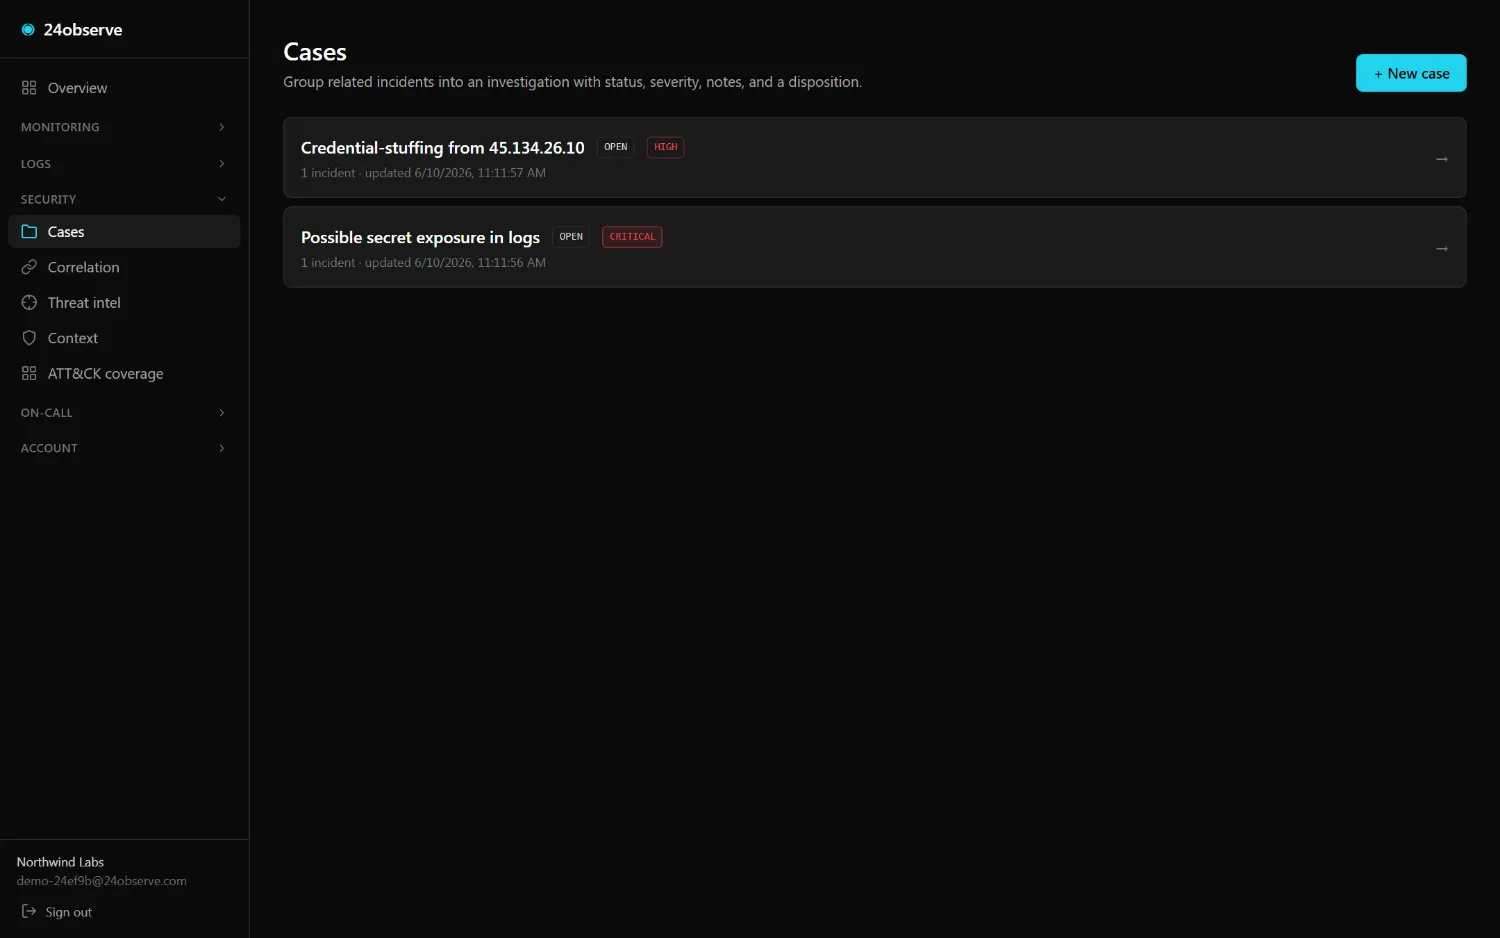
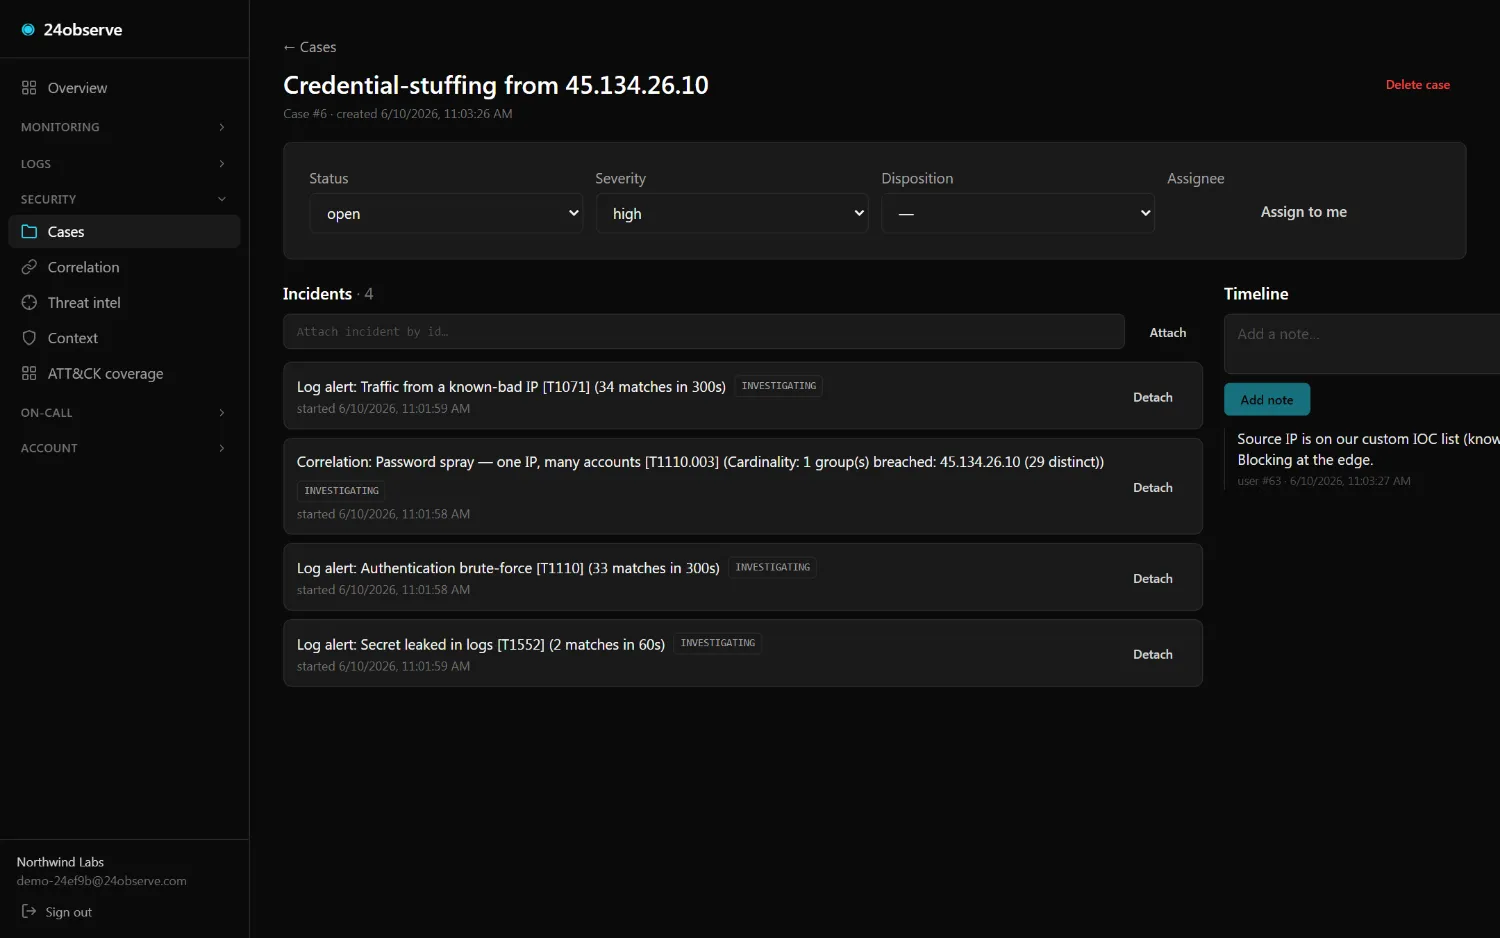
05 / INVESTIGATE

Security cases

Group incidents into one investigation — status, severity, assignee, a notes timeline, and a true-/false-positive disposition. The analyst workspace, not a shared spreadsheet.

06 / EXPORT

SIEM-ready out

Forward-cursor NDJSON export so Splunk, Datadog, or your own SIEM polls the trail gap-free. Signed webhooks route every detection straight to SOAR.

Every plan gets every detection — no "security tier", no per-GB intelligence meter.

Why 24observe

Four reasons. The fourth is the one most vendors get wrong.

01 / PRICE

One platform, one predictable bill

From $9/mo for 100 monitors — with logs and a full SIEM in the same bill, at a fraction of the cost of stitching together three separate vendors. Flat pricing that scales with your stack: no per-host metering, no per-seat tax, no surprise overage.

02 / SOVEREIGNTY

Self-hostable, end to end

Deployable entirely on infrastructure you control. No vendor lock-in, no data leaving your environment, no "enterprise" tier gating encryption — your observability stays under your governance, on your terms.

03 / TRACEABILITY

Audit log on every change

Every account-mutating action — create, update, delete, role change, secret rotation — recorded with actor + resource + timestamp. PAT-attributed, so you can answer "what did the agent do?" with one SQL-style query.

04 / AGENT-NATIVE

Built so a Claude or GPT tool call can run it

Pure REST — no SDK to keep in step. Pre-converted tool definitions for OpenAI, Anthropic, and LangChain. Event webhooks replace polling. Rate-limit headers your agent can read. Idempotency-Key on every mutation. /agents →

Under the hood

For the engineer signing the PO.

Every line is true today. No roadmap asterisks.

Intervals
Checks every 60s / 5m / 15m / 30m / 1h — your choice per monitor.
Idempotent retries
Transient failures retry automatically with backoff. A retried check cannot re-page the same incident twice.
Auth
Industry-standard password hashing, short-lived sessions with instant revocation, custom request headers encrypted at rest.
Tenancy
Multi-tenant by default — every row filtered by your organization. Cross-tenant access returns 404, never someone else's data.
Signed webhooks
Every outbound webhook signed so your receiver can verify it came from us. Rotate the secret one-click.
API
OpenAPI spec live from day one — /openapi.json. Generate a typed client in any language.
Audit log
Every mutation recorded with actor + resource + timestamp. Exportable as CSV or streamed to your SIEM.
Backups
Continuous point-in-time backups of your data. Restore to any moment.
SLO targets
Set 99.9% / 30 days, get green/red badges and breach alerts.
Public uptime badge
Live SVG you can drop into a README — no script tags, no analytics calls.
Pricing

Transparent pricing for the entire platform.

Uptime, logs, and the SIEM on one predictable bill — no per-host metering, no per-seat tax, no "contact sales."

Plan
24Observe
Legacy equivalent
You save
Starter 10 monitors · 5-min interval
Free
$15/mo
Pingdom
$180/yr
Scale 1,000 monitors · 1-min interval
$49 /mo
$500+/mo
Datadog
$5,400+/yr
Self-host unlimited · your hardware
Free forever
closed source
Priceless
// competitor prices sampled 2026-04 · sources linked in /docs/pricing-comparison
Objections, handled

The things every engineer asks us.

Is it reliable and safe enough for production?
Every check ships with anti-abuse defenses that prevent it from being misdirected at your private network or cloud-metadata endpoints, so a monitor can never be weaponised against your own infrastructure. Sensitive fields are encrypted at rest and every action is audited. Read our trust commitments →
A SIEM too? Is the security stuff real or a checkbox?
Real and live. 41 detections with MITRE ATT&CK ids, multi-event correlation over ClickHouse, threat-intel matching at ingest, GeoIP/identity/asset enrichment, and security cases — every one verified end-to-end in production. See what the SIEM does →
What happens if you go down?
The platform is source-available and can run entirely on your own infrastructure, so your monitoring is never dependent on a single vendor's uptime. Deploy it in your environment and keep full continuity. See the self-host guide →
How do I know what you're doing with my data?
Sensitive fields encrypted at rest. Every mutation written to a per-org audit log you can read, export, and stream to your own SIEM. Read the privacy policy →
60 seconds to first tick

Start watching in 60 seconds.

Sign up and we run it for you, or fork the source and run it yourself.